Insights
Have you got energy-bill blindness?
Understanding the complexity can be key to energy-efficient savings.
We often ask our clients: have you ever thought about the various elements that make up your building’s (or estate’s) energy bills?
It’s a lot more complicated than most people realise and – when it comes to the performance of buildings – understanding the breakdown can help teams realise the areas where energy can be used in a more efficient way.
What lots of our clients don’t realise is that bills aren’t solely made up of the cost of the energy they use – it’s actually much more complex.
Gas bills.
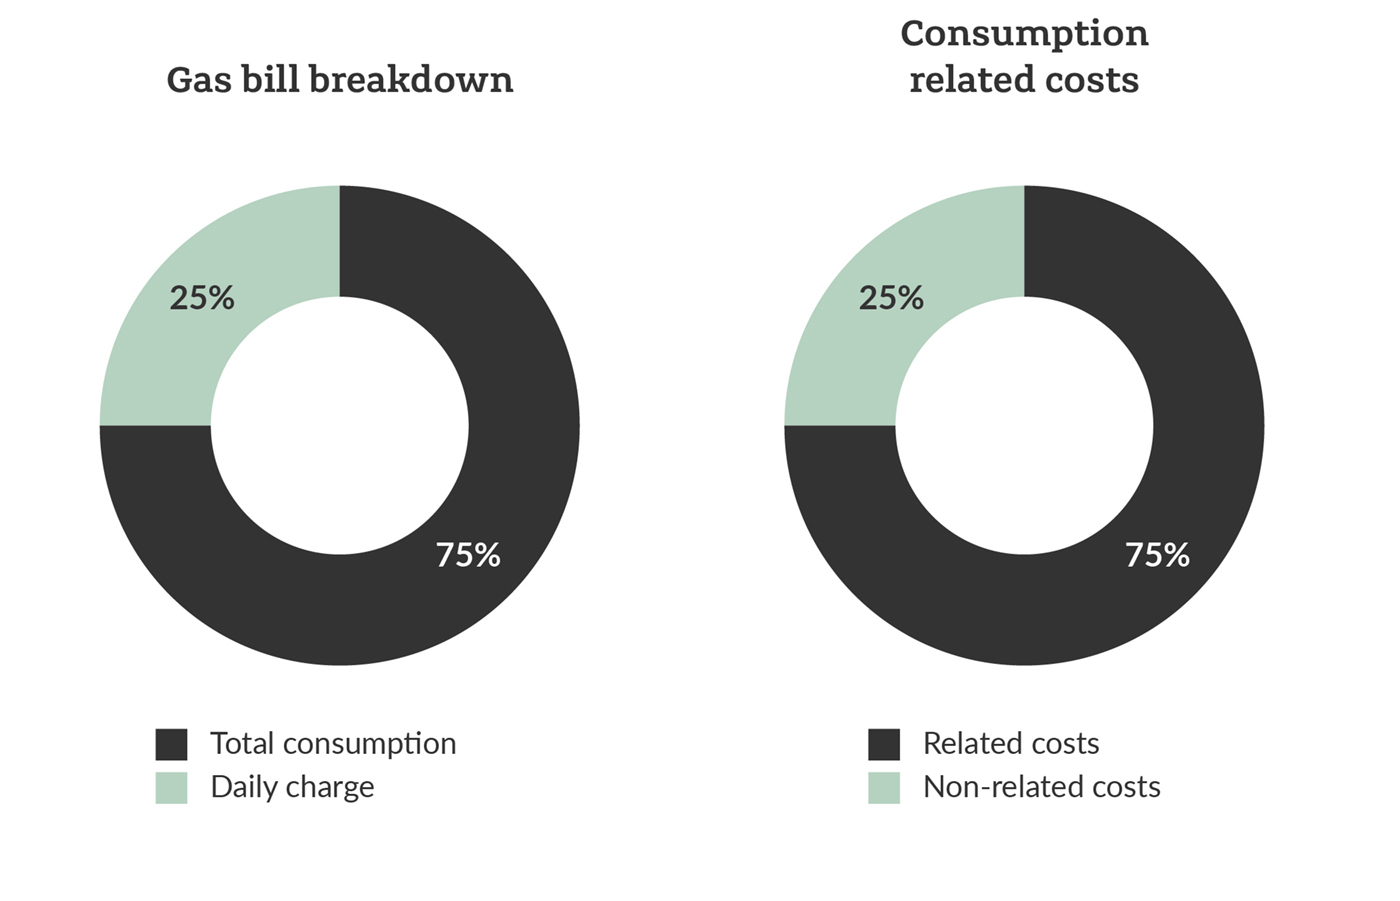
Let’s start with gas bills: the graphs below show that most gas bills are essentially “what you see is what you get”.
The graph on the left shows how the total gas consumption compares against the daily charge cost (before VAT).
Meanwhile, the graph on the right shows the split between ‘fixed’ costs (i.e. non-consumption related costs) and variable consumption costs. Together, this means gas bills are actually pretty easy for the customer to understand.

Energy bills.
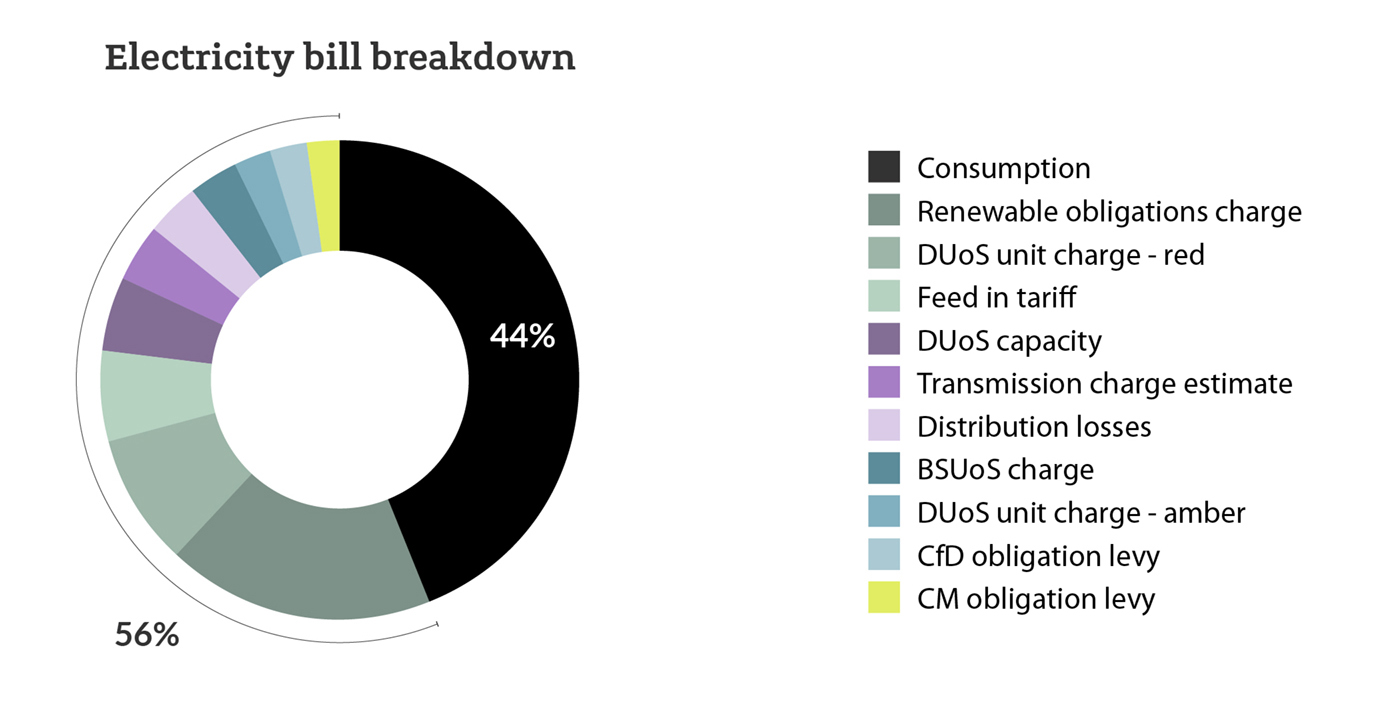
Energy bills, however, are far more complicated. They’re made up of a myriad of individual charges all shown in the chart below.

This complexity makes it difficult for clients to compare kWh savings to £s when it comes to their building’s electricity consumption.
When a kWh saving is stated to a client, they may assume that the percentage saving in kWh will affect their bills in the same way. Sadly, this is not the case and, in some cases, savings can be significantly less.
With varying tariffs available, it can be even more difficult to calculate cost savings as it can vary drastically from project to project. As Performance Engineers, understanding which energy tariff our clients are on is vital in providing an accurate saving estimate. We can then help our clients to more easily understand how costs and tariff choice can affect their cost per kWh…. And – most importantly – explore further ways to generate energy-efficient savings.